Seeing Data Clearly with the Four Aspects Percentage Chart in Business
You have a set of numbers that tell an important story about your business. Maybe it's a quarterly breakdown of revenue streams, a customer satisfaction survey, or a competitive analysis showing where your brand stands. The challenge isn't the data itself—it's making that data immediately understandable to anyone who glances at your slide, report, or dashboard. That's exactly where a Four Aspects Percentage Chart becomes genuinely valuable. It takes four related categories, expresses each as a percentage, and arranges them visually so comparisons feel natural rather than forced.
This type of chart sits at the intersection of comparison, diagram, and design. When crafted thoughtfully, it transforms abstract figures into something a room full of stakeholders can grasp within seconds. But here's the catch: a tool this flexible is also easy to misuse. Many people download a template, plug in numbers, and assume the job is done. The result can be confusing, misleading, or just visually forgettable. Let's walk through what this chart does well, where people tend to stumble, and how you can sidestep those pitfalls to create something that genuinely works.
What Makes a Four Aspects Percentage Chart Different
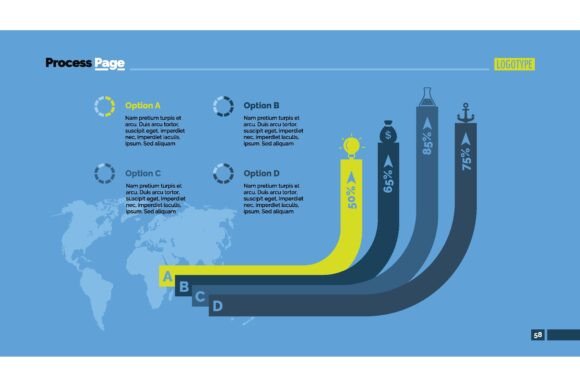
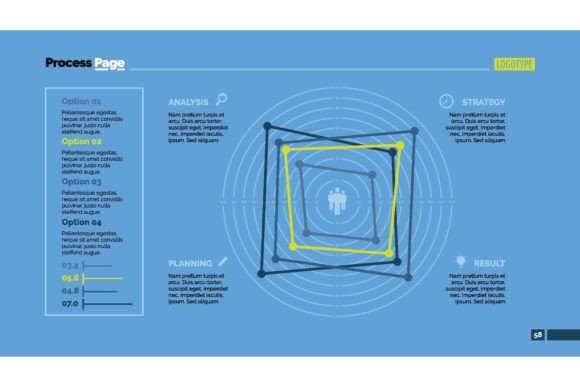
You have probably seen variations of this graphic without knowing its name. Think of a circle split into four proportional segments, each labeled with a percentage and a short descriptor. Or a horizontal bar layout with four color-coded sections. Or even a radar-style quadrant where each axis represents a different aspect of a business function. The unifying idea is simple: four distinct elements, each expressed as a proportion of a whole or as a standalone metric, arranged so the viewer can compare them instantly.
Businesses gravitate toward this format because it handles several communication needs at once. You can show market share among four competitors. You can break down a budget allocation. You can display skill assessments across four competencies. The chart works in boardroom presentations, investor pitch decks, blog posts, and internal training materials. Its versatility explains why infographic designers and report creators keep returning to the four-aspect structure.
Yet popularity breeds carelessness. When a chart type becomes familiar, people stop questioning whether they are using it correctly. That leads to the first cluster of mistakes worth addressing.
Design Decisions That Undermine Your Message
A well-intentioned chart can fall apart before anyone reads a single number. The visual layer is not decoration—it is the first thing your audience processes. When the design works against clarity, comprehension suffers immediately.
Color Choices That Confuse Rather Than Clarify
One of the most frequent missteps involves picking colors that are too similar. You have four segments representing four different aspects. If you use four shades of blue that barely differ from one another, you are asking your audience to squint and guess. The same applies to overly vibrant, clashing palettes that make the chart feel chaotic. Color in a Four Aspects Percentage Chart should do two things: distinguish each category clearly and guide the eye in a logical order.
A better approach is to choose a palette with enough contrast. You might use a dominant brand color for the largest segment and complementary or analogous tones for the remaining three. If your chart will appear in grayscale printouts—common in corporate environments—test it without color. Can you still tell the segments apart? If not, add subtle pattern fills, border weight differences, or label positioning that compensates.
Ignoring the Hierarchy of Information
Another design flaw is treating all four aspects as equally important when they are not. If one percentage dwarfs the others, your layout should reflect that reality. Some people force a perfectly symmetrical quadrant design even when one segment represents sixty percent and another represents five. The chart ends up looking balanced on the surface while distorting the proportional truth. For percentage data where the numbers do not add up to a neat hundred across equal parts, consider a proportional area chart or a weighted layout that respects the actual values.
Ask yourself before finalizing: does the visual weight of each section match the number it represents? If not, your design is silently contradicting your data.
Data Integrity Mistakes That Erode Trust
Even a beautiful chart becomes useless—or worse, damaging—if the underlying numbers are handled carelessly. Audiences are more data-literate than ever. Someone in the room will notice if percentages feel off or if the math does not add up.
Percentages That Do Not Belong Together
A common error is lumping four metrics into one chart when they do not share a common baseline. For example, showing customer acquisition cost, employee turnover rate, net promoter score, and website bounce rate as four aspects in a single percentage chart is confusing. These numbers come from different scales and measurement systems. A Four Aspects Percentage Chart works best when the categories are conceptually related and comparable. Think of four product lines contributing to total revenue, or four departments and their share of the annual budget.
If your four metrics are not naturally part of the same family, reconsider whether this chart type is the right vehicle. You might be better served by four separate gauge visuals or a small multiples layout where each metric gets its own properly scaled display.
Rounding Errors and Sloppy Totals
When the four percentages are meant to sum to one hundred, they should actually sum to one hundred. Not ninety-nine. Not one hundred and one. Rounding each number individually can introduce small discrepancies. A chart labeled with 33%, 33%, 17%, and 17% looks clean, but if the raw data is 33.3%, 33.3%, 16.7%, and 16.7%, you may want to show one decimal place or add a footnote explaining the rounding. Trust is fragile. A minor arithmetic slip in a visible chart can cause stakeholders to question the rigor behind your entire presentation.
Presentation and Context Errors
Your chart does not exist in a vacuum. It sits on a slide, inside a document, or within a webpage surrounded by other elements. Failing to account for context is a subtle but significant oversight.
Missing Labels, Legends, and Source Notes
Imagine seeing four colorful segments with percentages but no labels explaining what each segment represents. The viewer spends mental energy trying to decode the visual instead of absorbing the insight. Every Four Aspects Percentage Chart needs clear, readable labels positioned close to the corresponding segments. If space constraints force you to use a legend, place it near the chart rather than in a corner where the eye must travel back and forth.
Equally important is citing your data source. Whether the numbers come from internal analytics, a third-party research firm, or a customer survey, a small source line beneath the chart adds credibility. It signals that you are not inventing figures and that anyone who wants to dig deeper knows where to look.
Overloading a Single Chart
Some creators try to squeeze too much into one graphic. They add explanatory paragraphs inside the chart area, overlay trend arrows, insert icons, and apply heavy drop shadows. The result is visual noise. A percentage chart should breathe. Let the four aspects stand out. If you need to communicate additional layers of information—like year-over-year change or qualitative commentary—place those details in accompanying text or use a secondary, simpler visual nearby.
Practical Ways to Improve Your Charts Today
Small adjustments can dramatically elevate the quality of your data presentation. Start by asking whether each of the four aspects deserves its place in the chart. If one category feels forced or trivial, consider combining it with another or replacing it with a more meaningful metric. The goal is not to fill four slots but to tell a coherent story with four well-chosen data points.
Test your draft chart on someone who has no background in the data. Hand them the graphic without explanation and ask what they understand from it. Their response will quickly reveal whether your labels, colors, and layout are doing their job. If they pause, squint, or misinterpret a segment, you know exactly where to refine.
Pay attention to the medium where the chart will appear. A chart designed for a large presentation screen can afford smaller labels and finer details because the projection magnifies everything. The same chart embedded in a printed report at A4 size may become illegible. Adjust font sizes, line weights, and contrast accordingly. For digital use, test how the chart renders on a mobile phone screen, especially if it will appear in an email or on a blog.
What to Check Before Finalizing Your Chart
Before you hit send, insert, or publish, run through a brief checklist. Verify that all four percentages are accurate and properly sourced. Confirm that the visual proportions match the numerical values. Ensure the color palette is accessible to color-blind viewers—tools like Coblis or Color Oracle can help. Review the chart at the size it will be viewed. Read every label aloud to catch typos or inconsistent terminology. If you used abbreviations, make sure they are defined somewhere on the same page.
Also consider the emotional tone your chart sets. Bright, saturated colors can feel energetic and optimistic, which works well for growth metrics. Muted, professional tones suit serious topics like risk assessments or compliance data. The aesthetic should align with the message, not fight against it.
Why Getting This Right Matters
A thoughtfully designed Four Aspects Percentage Chart does more than display numbers. It builds confidence in your analysis, accelerates decision-making, and helps your audience remember the key points long after the presentation ends. When you avoid the common traps—poor color selection, mismatched data, missing context, and visual clutter—you transform a basic graphic into a genuine communication asset.
Take the extra few minutes to refine your chart. The return on that small investment is a clearer message, a more engaged audience, and a reputation for delivering data that people can actually understand and act upon. Whether you are a marketer sharing campaign results, a founder pitching to investors, or an educator explaining research findings, the quality of your visual storytelling shapes how your work is perceived. Make every percentage count.