Horizontal Bar Charts and Business Data: Refining How We Interpret Performance Per Metric
Numbers sit quietly in spreadsheets until someone gives them shape. The horizontal bar chart does exactly that — it pulls rows of business data into a visual sequence that the human eye can scan, compare, and understand in seconds rather than minutes. When every percentage point matters — when performance is measured per department, per quarter, per product line — the orientation of those bars changes how quickly decisions get made. This is not simply about aesthetics. It is about cognitive speed and analytical clarity.
Why Horizontal Orientation Matters More Than People Assume
Most of us grew up seeing vertical bar charts in textbooks and boardrooms. The vertical format feels familiar. Yet business data often contains category labels that are long, descriptive, and unwieldy — names of product categories, regional divisions, or service tiers that refuse to fit neatly beneath a vertical column. A horizontal bar chart solves this before it becomes a problem. Labels sit to the left, reading naturally from left to right, with ample room to breathe. The bars stretch rightward, and the viewer's gaze follows without friction.
This directional flow aligns with how many languages are read, which means comprehension happens faster. In meetings where stakeholders have limited attention, that speed translates directly into engagement. Someone can glance at a horizontal bar chart showing revenue per sales representative and immediately spot who leads and who lags — no head-tilting, no squinting at angled text, no mental gymnastics required.
Business Data Density and the Case for Horizontal Layouts
Datasets in corporate environments rarely arrive tidy. They carry multiple dimensions — time periods, geographic segments, customer cohorts — and the person presenting the data must decide how to layer meaning without creating clutter. Horizontal bars accommodate longer category names gracefully, which makes them ideal when displaying survey results, employee performance metrics, or inventory counts across dozens of stock-keeping units.
Consider a procurement team reviewing supplier performance per contract. Each supplier name might span twenty characters or more. A vertical chart would truncate or rotate those labels, introducing friction. A horizontal bar chart keeps names legible and places the quantitative comparison front and center. The visual emphasis lands on the length of the bar, which represents the metric that matters — delivery timeliness, defect rate, cost variance. This is business data storytelling at its most direct.
Reading Percentages and Proportions With Greater Precision
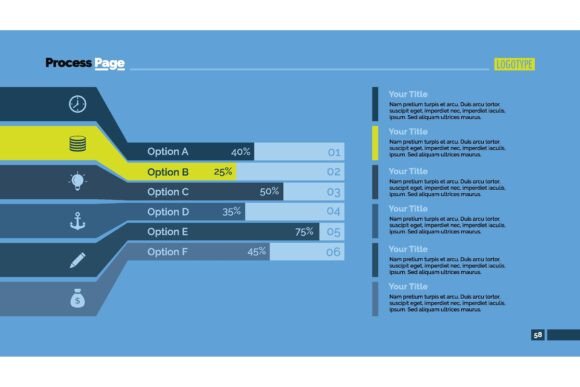
When the unit of measurement is a percentage, precision becomes paramount. A horizontal bar chart displaying completion rates per project phase gives stakeholders an immediate sense of progress without requiring them to parse decimal points. The eye judges length more accurately than angle, which is why bar charts generally outperform pie charts for fine comparisons — and horizontal bars make those comparisons feel effortless.
Imagine a dashboard tracking customer satisfaction scores across ten service channels. Each score is a percentage. Arranged horizontally, the bars create a ranked list that highlights the strongest and weakest channels instantly. Decision-makers can move from observation to action without the intermediate step of decoding the visualization. This is where the tool transcends mere presentation and becomes a diagnostic instrument.
Crafting Diagrams That Communicate Before They Decorate
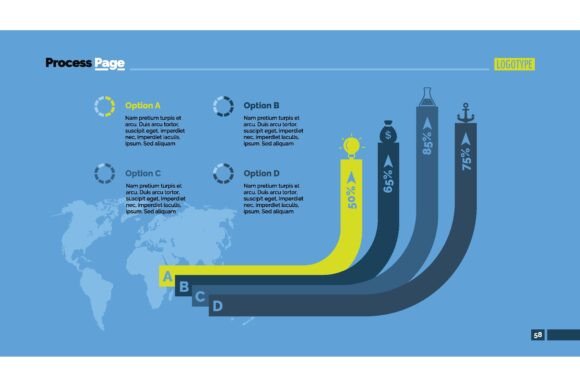
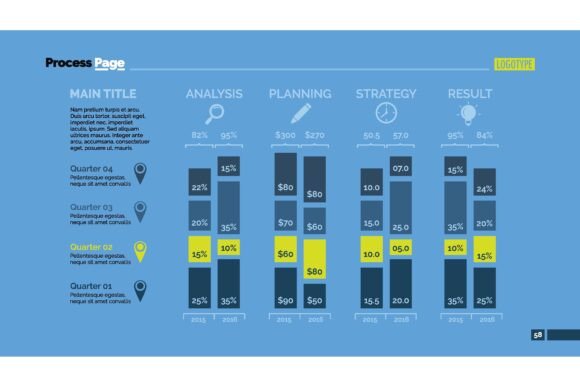
Color often gets treated as decoration. In a well-designed horizontal bar chart, color carries meaning. It can group categories by region, distinguish actuals from targets, or signal performance thresholds — green for above target, amber for within tolerance, red for below. The diagram becomes a dashboard in miniature, condensing layers of business data into a single coherent image.
Design choices like bar width, spacing, and label positioning affect readability. Bars that are too thin feel insubstantial; bars that are too thick suggest blockiness rather than precision. The spacing between bars should be less than the bar width itself — a guideline drawn from perceptual research — so that the viewer's eye groups the data correctly. When these elements harmonize, the chart feels inevitable, as if the data arranged itself that way naturally.
Infographics That Respect the Viewer's Intelligence
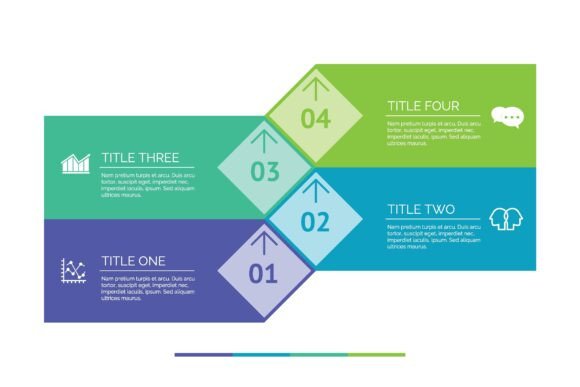
Infographics have a reputation for style over substance, but that reputation is earned by bad examples, not by the format itself. A horizontal bar chart embedded in an infographic can deliver dense information without sacrificing visual appeal. The key is restraint — using illustrations or icons sparingly to support the data rather than distract from it.
For a report on global market share per competitor, horizontal bars can be accompanied by minimal brand logos aligned with each row. The logos add immediate recognition without impeding the numerical comparison. The result feels informative rather than promotional — trustworthy, which matters when the audience includes analysts, journalists, or regulators who see through fluff.
Templates That Save Time Without Sacrificing Quality
Recurring reports benefit from consistency. A horizontal bar chart template, once established, lets teams drop in fresh business data and generate polished output in minutes. Finance departments use them for monthly budget variance reviews. Human resources teams use them for headcount summaries per division. Marketing teams use them for campaign performance comparisons.
The template approach does not mean monotony. Subtle variations — swapping color palettes, adjusting scale ranges, highlighting specific bars — keep each report tailored to its context while preserving the structural familiarity that returning readers appreciate. Familiarity breeds speed, and speed in business communication is a competitive advantage.
Presentations Where Data Leads the Narrative
Slide decks often suffer from information overload. A single slide crammed with multiple charts, bullet points, and commentary fragments the audience's attention. A horizontal bar chart displayed alone on a slide commands focus. The presenter can narrate the story — "Here is the revenue contribution per product line, and the top three account for sixty percent" — while the visual reinforces every word.
This alignment between spoken narrative and visual evidence builds credibility. The audience can verify the claim by looking at the chart themselves, which engages their analytical faculties rather than putting them in a passive listening mode. Engagement, in turn, leads to better questions, richer discussion, and decisions grounded in shared understanding of the business data.
Comprehensive Reports and the Role of Consistent Visual Language
Lengthy reports — annual reviews, feasibility studies, due diligence documents — contain dozens of exhibits. When every chart uses a different format, the reader must reorient themselves repeatedly, burning cognitive energy on navigation rather than insight. Standardizing on the horizontal bar chart for category comparisons creates a visual rhythm that carries the reader through the document.
A report analyzing operational efficiency might use horizontal bars to compare cycle times across facilities, error rates across shifts, and throughput across equipment types. Though the metrics differ, the consistent format signals to the reader: this is a comparison. The reader internalizes the convention and focuses on the numbers, which is exactly where their attention belongs.
Accounting Scenarios That Demand Clarity and Accountability
Accounting data carries weight. Errors in interpretation can lead to misstated financials, compliance issues, or strategic missteps. A horizontal bar chart displaying expense categories per cost center gives auditors and controllers a transparent view of resource allocation. Anomalies stand out — a bar that extends far beyond its peers invites investigation.
The format also supports drill-down conversations. A manager reviewing travel expenses sees an unusually long bar for a particular department. Clicking through — or flipping to the next page of the printed report — reveals a more granular breakdown, also presented in the same horizontal format. Continuity of design across levels of detail preserves context and reduces cognitive load.
Financial Analysis Where Small Differences Carry Big Consequences
Investment analysts pore over margins, growth rates, and return ratios. A difference of half a percentage point can reshape a recommendation. The horizontal bar chart excels at surfacing small disparities because the human visual system compares lengths along a common baseline with remarkable sensitivity. Two bars representing net margins of 12.3% and 12.8% may look nearly identical in isolation, but placed side by side along a consistent scale, the difference becomes perceptible.
Analysts can use horizontal bars to compare a company's metrics against industry benchmarks, historical averages, or peer group medians. Each comparison tells part of the story, and the visual format encourages the analyst to ask the next question — why is this metric different, and what does that imply for valuation?
Transforming Raw Output Into Meaningful Narrative
Raw data intimidates. Even seasoned professionals can feel overwhelmed by tables of numbers extending beyond the screen. A horizontal bar chart imposes order on that chaos, extracting a single meaningful dimension and rendering it legible. The act of choosing which metric to plot — and which categories to include — forces clarity of thought before the visualization is even created.
This selection process is editorial. It answers the question: what matters most in this business data set? The answer might be revenue per customer segment, defect rate per production batch, or engagement per marketing channel. Whatever the metric, the horizontal format ensures that the answer appears in a form that invites discussion rather than ending it.
Accessibility Considerations That Broaden the Audience
Data visualization carries an ethical dimension. Charts should be interpretable by people with varying levels of visual acuity and color perception. Horizontal bars, when designed with sufficient contrast and accompanied by clear labeling, serve a wider audience than formats that rely solely on color coding or intricate radial designs.
Screen readers can parse the underlying data when it is provided in accessible formats alongside the visual. The horizontal bar chart image can be supplemented with descriptive alt text and a data table, ensuring that the insights reach everyone who needs them — a principle that aligns with both regulatory requirements and inclusive design philosophy.
Dynamic Use Cases That Extend Beyond the Boardroom
While corporate finance departments are heavy users, the horizontal bar chart finds application in contexts that range from academic research to personal productivity tracking. A researcher comparing publication counts per institution over a decade can present findings with immediate visual impact. A hobbyist tracking monthly expenses can see spending patterns emerge without needing advanced analytical skills.
The format democratizes data interpretation. It does not require training in statistics to read, yet it rewards the statistically sophisticated with its precision. This dual appeal — accessible to beginners, valuable to experts — explains its persistence across software platforms, from spreadsheet applications to advanced business intelligence tools.
Selecting the Right Tool and Avoiding Common Pitfalls
Not every dataset suits a horizontal layout. Time series data, where the sequential order of periods matters more than the magnitude at each point, often reads better in a vertical or line format. The horizontal bar chart shines when categories are discrete, unordered, and benefit from ranking — but applying it to chronological data can mislead by implying that the sequence is irrelevant.
Scale choices also demand care. A truncated baseline exaggerates differences; an overly broad scale compresses them into invisibility. Responsible chart design means choosing scales that represent the business data honestly, respecting both the audience's intelligence and the analyst's obligation to accuracy.
Integrating Horizontal Bar Charts Into a Broader Analytical Workflow
The chart is rarely the final destination. It is a waypoint — a tool for exploration, validation, and communication. Analysts might begin with a horizontal bar chart to identify outliers, then switch to statistical methods to test hypotheses, then return to the chart format for the final presentation layer. This iterative relationship between visual and quantitative analysis enriches both.
When organizations build data cultures, they invest not only in tools but in visual literacy. Teaching teams how to read and create effective horizontal bar charts — understanding what the bars represent, how to interpret the scale, what the colors signify — pays dividends in faster, better-informed decisions. The chart becomes a shared language, reducing misunderstanding and aligning diverse stakeholders around a common view of the business data.
Future Relevance in an Age of Automation
As dashboards become automated and reports generate themselves, the design choices embedded in templates become ever more influential. The default chart type becomes the default lens through which organizations see themselves. Choosing the horizontal bar chart as that default for categorical comparisons is a quiet decision with outsized consequences — it prioritizes readability, accommodates diverse label lengths, and encourages ranking-based thinking.
Artificial intelligence tools can now suggest chart types based on data structure, but human judgment remains essential. Knowing that a horizontal layout suits particular analytical questions — and having the vocabulary to articulate why — keeps the human in the loop, guiding the machine toward outputs that serve genuine understanding rather than mere decoration.